Scaling Energy Audits to Support Policy Planning for A Major City

As cities around the globe set decarbonization and net-zero goals to address the severe effects of climate change, ensuring energy efficient buildings is becoming an increasingly important priority for cities. Considering high-performing envelopes are the most effective way to reduce the thermal needs of buildings, understanding the energy usage and savings opportunities related to building envelopes is essential for cities in achieving their sustainability goals.
As such, a major capital city sought QEA Tech’s services to accelerate its ambitious energy transition strategy. Specifically, the City needed QEA Tech to validate assumptions it had made regarding the energy efficiency of its buildings. Aiming to reduce greenhouse gas emissions to zero by 2050, through key actions such as retrofitting existing residential and commercial buildings, QEA Tech’s analysis was necessary for the City to gain a clear understanding of the energy performance of its buildings. This analysis was also essential to tailoring retrofit programs and policies to meet the specific needs of the City’s built environment. QEA Tech collected thermal and visual data for the buildings identified by the City, then analyzed and compared the data to the City’s energy assumptions and targets.
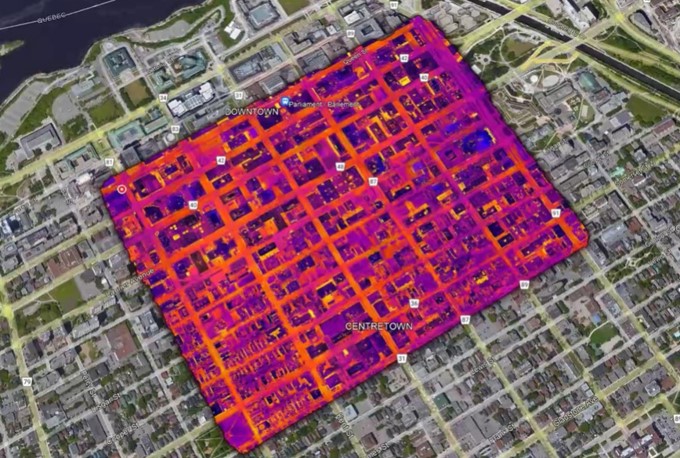
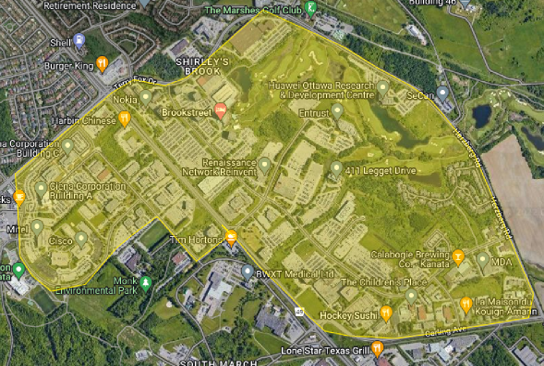
QEA Tech conducted audits for 190 buildings, ranging from commercial to residential properties, within two large catchment areas. QEA Tech captured over 16,000 images in total, which our AI-powered software and team of building science specialists then analyzed. The scope of the analysis consisted of:
1. Number and percent of buildings considered to have major issues associated with their building envelope.
2. Number and percent of buildings with evidence of water ingress.
3. Average energy loss per meter square per building envelope.
4. Energy savings potential and GHG savings potential per square meter of building envelope element.
5. Identification of major patterns and trends in building envelope performance that need to be investigated further.
6. Average effective U-value for building envelope elements compared to the City’s energy assumptions and targets.
Key Findings: The Reality of Building Envelope Performance Across the City
QEA Tech’s audit of the two catchment areas found the City’s assumptions on the energy performance of its building envelopes to be more optimistic than the reality. QEA Tech’s audit revealed that:
1. 56% of average annual energy loss in megawatt-hours per meter squared (MWh/m2) from all building envelope elements can be avoided by upgrading building envelopes to building code.
2. 97% of buildings assessed across the two catchment areas did not meet the City’s initial performance assumptions.
3. 68-1123 tonnes of carbon dioxide equivalent (tCO2e) are avoidable annually per building.
4. 64% of the buildings assessed showed signs of water ingress.
Average U-Values (W/m2k) of Building Elements Compared to Building Code
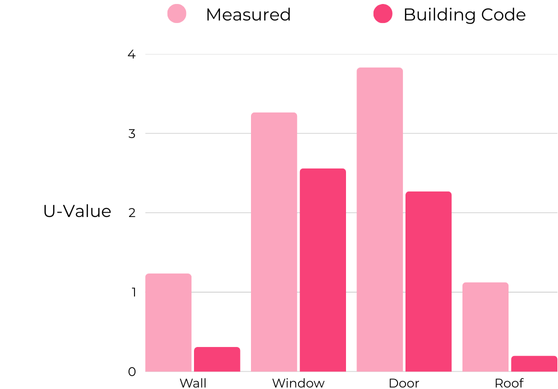
QEA Tech found that the average building envelopes were performing 75% worse compared to current building code. Additionally, the City had assumed building envelope U-values were performing 50% better than the actuals measured by QEA Tech.
QEA Tech’s ability to calculate accurate and precise U-values for the building envelope enabled the City to have a clearer understanding on the actual performance of its buildings, allowing it to better plan energy efficiency measures.
Performance Trends and Patterns Across Building Envelopes
Occurrences of Building Envelope Issues
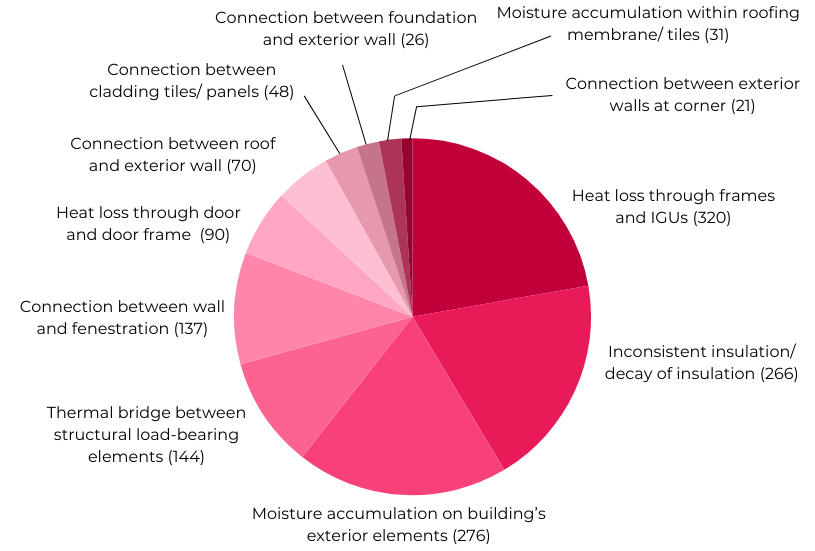
QEA Tech provided customized reports that identified issues specific to every building envelope for each of the 190 buildings in-scope of this engagement. Further, QEA Tech analyzed data across the 190 buildings to identify key trends and patterns in building envelope performance, supporting city benchmarking and policy planning. QEA Tech found that:
1. Building envelopes in the second catchment area performed slightly better than buildings in the first catchment area. The younger age of the buildings in the second catchment area are likely a contributing factor to their more efficient performance.
2. Key issues across building envelopes were heat loss due to connections between different materials, thermal bridging, inconsistent or decay of insulation, heat loss through doors and frames, and moisture accumulation.
3. Moisture accumulation issues were more common in buildings in the first catchment area and were more common in older buildings.
Building Envelope Issues: Closer Look
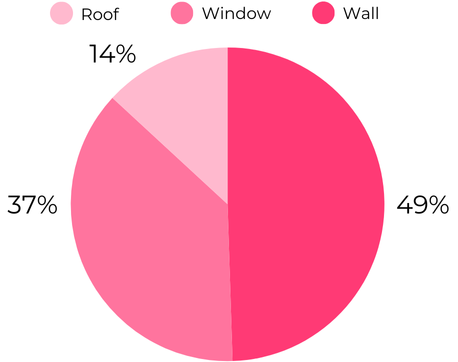
Heat Loss through Frames and IGUs
A staggering 158 of the buildings analyzed had instances of heat loss through window frames and insulated glass units (IGUs). Heat loss through IGUs occurs due to window assemblies failing to maintain an effective thermal barrier, allowing heating and cooling to escape from the building. This could be a result of seals between panes of glass degrading and allowing insulting gas to escape and moisture to enter, or inadequate window glazing. Heat loss through window frames often occurs due to frames being made from highly conductive materials (e.g. aluminum), allowing heat to easily transfer between the inside and outside of the building. Additionally, when frames are not sealed properly against the wall, it can lead to gaps that allow heat to escape.
For several instances, to mitigate heat loss through IGUs, building owners can implement window inserts, which are customized glass panes that can be placed on the inside or outside of the existing window. This creates a new thermal boundary that improves U-values. Window inserts are ideal for buildings throughout the two catchment areas that are interested in preserving their original frames for historical or aesthetic reasons, that are working with a constrained timeline and budget, or that want to maintain their window’s original size and operating style. Window inserts work best with structurally sound wood or aluminum frames. To decrease energy loss from uninsulated framing, energy efficient frames (e.g. vinyl frames) with improved glazing should be implemented.
Inconsistent and Decay of Insulation
QEA Tech identified instances of inconsistent and decay of insulation for 126 of the buildings analyzed. When insulation is poorly installed or compromised over time, it can lead to gaps that allow heating or cooling to escape, causing energy costs to increase. Considering the older ages of the buildings audited, it is also likely that insulation of most buildings settled, compressed, or degraded over time, leading to reduced effectiveness. Areas with inconsistent or decaying insulation contribute to drafts, cold spots, and moisture issues, causing tenant discomfort and further degrading building materials.
Depending on the building usage and architecture, interior insulation (e.g. Batt insulation) should be applied or recladding should be completed. Interior insulation is best to use for buildings that have a smaller budget and that are interested in maintaining their outward appearance. Recladding is optimal if the operations of the building cannot be disrupted (e.g. for hospitals).
A More Effective Path to Energy Transition
QEA Tech’s usage of our patented AI software and drones enabled us to collect and analyze building envelope data quickly, cost-effectively, and without disturbing city residents and building owners. Our technology also allowed our audit to be scalable, a necessity when collecting and analyzing data for large city blocks. QEA Tech’s efficient, detailed, and precise approach has provided the City with a clear picture of the energy performance of its building stock, allowing it to take informed action. The City now has accurate data to enhance its energy transition strategy to fit the actual needs of its building envelopes. Further, the City is able to tailor its programs and policies to make retrofits more accessible for building owners and maximize their return on investment. As an interim step, the City has published the energy performance of each building analyzed.
If you are interested in gaining a deeper understanding of the energy efficiency of building envelopes in your portfolio, connect with QEA Tech for a free quote.